
Overall Analysis
Bitcoin started moving in a channel structure, with a price moving downwards. Still, November 4 turned out to be in the seller’s favour.
Ethereum tried holding the price higher but failed in the second half. Price is moving in the channel, indicating the seller’s market.
Bitcoin Chart Analysis
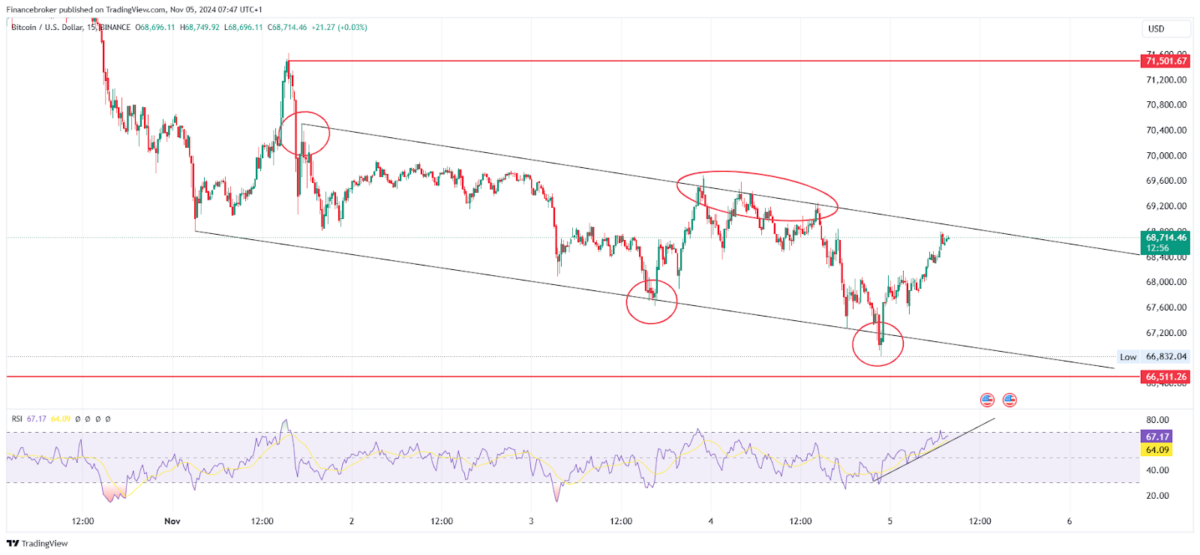
BTC/USD 15-Minute Chart (Source: TradingView)
On the October 4, 2024 trading session, Bitcoin fell after trying to hold the price on a higher level in the first half. It is moving in lower low and lower high patterns, indicating a selling trend in the crypto.
Furthermore, the price is presently moving in a channel, allowing buyers and sellers to create safe positions. Looking at the current trend, the crypto is trying to retest the resistance zone again. We can see RSI synced with the price trend clearly.
In such scenarios, market movers have a good opportunity to gain high returns as prices move in a systematic manner, allowing both buyers and sellers to play safe. Thus far, $66,511, which is an important support zone, has not been tested, but the price might go to retest the level so buyers can plan an entry.
Talking about the entry, below are the entry triggers.
The sellers can plan entry if the BTC price gets rejected from a resistant trendline with the stop loss above the previous low and target of $66,832.
If the price breaks the resistance channel and holds above it, then one can plan buy buy-side entry. However, traders should select a very small stop loss, as instant buying in a selling trend can be risky. They should place the stop loss below the previous swing low or the breakout candle, with a target of $69,759.
Ethereum Chart Analysis
ETH/USD 15-Minute Chart (Source: TradingView)
On the October 4, 2024, trading session, Ethereum tried holding the price at a higher level but eventually failed and fell sharply. The price can be seen clearly in the selling trend, respecting previous swings and highs.
Moreover, Ethereum gives smaller swings compared to Bitcoin, as its price is in a strong zone on a daily time frame.
Apart from small swings, prices are moving in the channel, indicating safe entry for market movers.
Looking into the chart for an entry, we see the entry trigger mentioned below.
It is better to let the price retest the resistance zone and face rejection from the level. Once the price rejects the trendline, traders can plan to sell-side entry with a stop loss above the previous swing high and target up to $2357.
The post Bitcoin and Ethereum Trends: Channel Analysis & Entry Points appeared first on FinanceBrokerage.

