
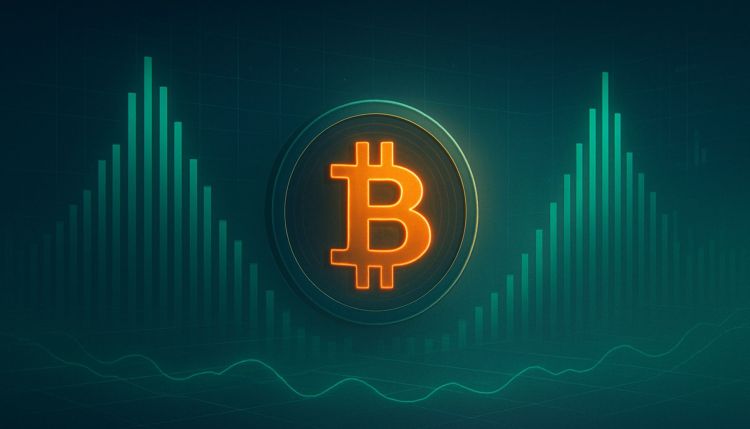
Bitcoin has slipped below the $100,000 mark, now trading around $97,000 for the first time since May, as selling pressure intensifies across the market. Bulls are struggling to defend critical support, and sentiment has turned decidedly fearful, with traders scaling back leverage and rotating into stablecoins amid heightened volatility. Despite this weakness, on-chain data suggests that large buyers may already be positioning for a potential rebound.
According to CryptoQuant analyst Maartunn, massive bid walls have been spotted on Binance Futures, signaling that aggressive buyers are stepping in to absorb the recent wave of selling. Historically, such large-scale bids have often coincided with local bottoms, as whales and institutional traders accumulate into weakness.
This emerging liquidity pattern may suggest growing confidence among deep-pocketed players that Bitcoin’s downside could be limited. However, with macro uncertainty still weighing heavily on the market, traders remain cautious.
Aggressive Buyers Step In As Bid Walls Signal Dip Accumulation
According to CryptoQuant analyst Maartunn, recent order book data reveals a strong layer of support forming on Binance Futures, where two major bid clusters have emerged — one around 800 BTC and another stacking up to 2,000 BTC. This concentration of buy orders suggests that large traders, often referred to as aggressive dip buyers, are actively accumulating Bitcoin at current levels around $97,000.
Bid walls of this size are significant because they indicate a willingness among deep-pocketed investors to absorb selling pressure and defend price levels perceived as undervalued. In practice, such large orders create a temporary price floor, making it harder for BTC to fall further without massive selling volume. This behavior is often observed in early phases of market reversals. Smart money begins building positions while retail sentiment remains fearful.
Maartunn notes that these clusters reflect renewed confidence from high-volume traders who see long-term value despite the recent correction. If these orders remain active and continue to absorb liquidity, Bitcoin could stabilize above the $95,000–$97,000 range. Historically, periods of strong bid support have preceded short-term relief rallies, suggesting that the current dip may be setting the stage for a broader recovery.
Bitcoin Tests Key Support After Losing $100K
Bitcoin’s price action has turned increasingly fragile, with the asset now trading near $96,800, its lowest level since May. The three-day chart shows a decisive break below the $100,000 psychological threshold, confirming a short-term bearish shift as sellers dominate. Volume has spiked notably in recent sessions, suggesting panic-driven liquidations as traders unwind leveraged positions.
The 50-day moving average has crossed below the 100-day, signaling fading momentum, while the 200-day moving average — currently near $88,000 — stands as the next central support zone if selling pressure persists. Despite the breakdown, price is showing early signs of stabilization around current levels, hinting that dip buyers may be stepping in.
Market structure remains corrective but not fully bearish. Bitcoin has repeatedly found support above its 200-day MA during previous mid-cycle retracements. A pattern that often precedes recovery once selling exhausts. The RSI (not shown here) is likely near oversold territory, reinforcing this view.
If BTC can reclaim and hold above $100,000, a short-term relief rally toward $105,000–$108,000 could unfold. However, failure to defend $95,000 may accelerate the decline toward $90,000. Overall, the chart reflects a market in consolidation, balancing between capitulation risk and early accumulation.
Featured image from ChatGPT, chart from TradingView.com

